A cricket fan rarely wants just the score. They want to know whether a chase is actually on, whether a batter is scoring against pace or falling to spin, whether a bowler is expensive because of the situation or because of the bowling, and whether tonight's innings was genuinely good or merely long. The scoreboard answers almost none of that.
Cricket has more public data than almost any sport—every delivery is recorded—yet most of it is trapped inside static scorecards. A boundary looks the same whether it came in the powerplay against the new ball or off a tired death-over slog. A fifty reads as a fifty whether it won a game or lost one slowly.
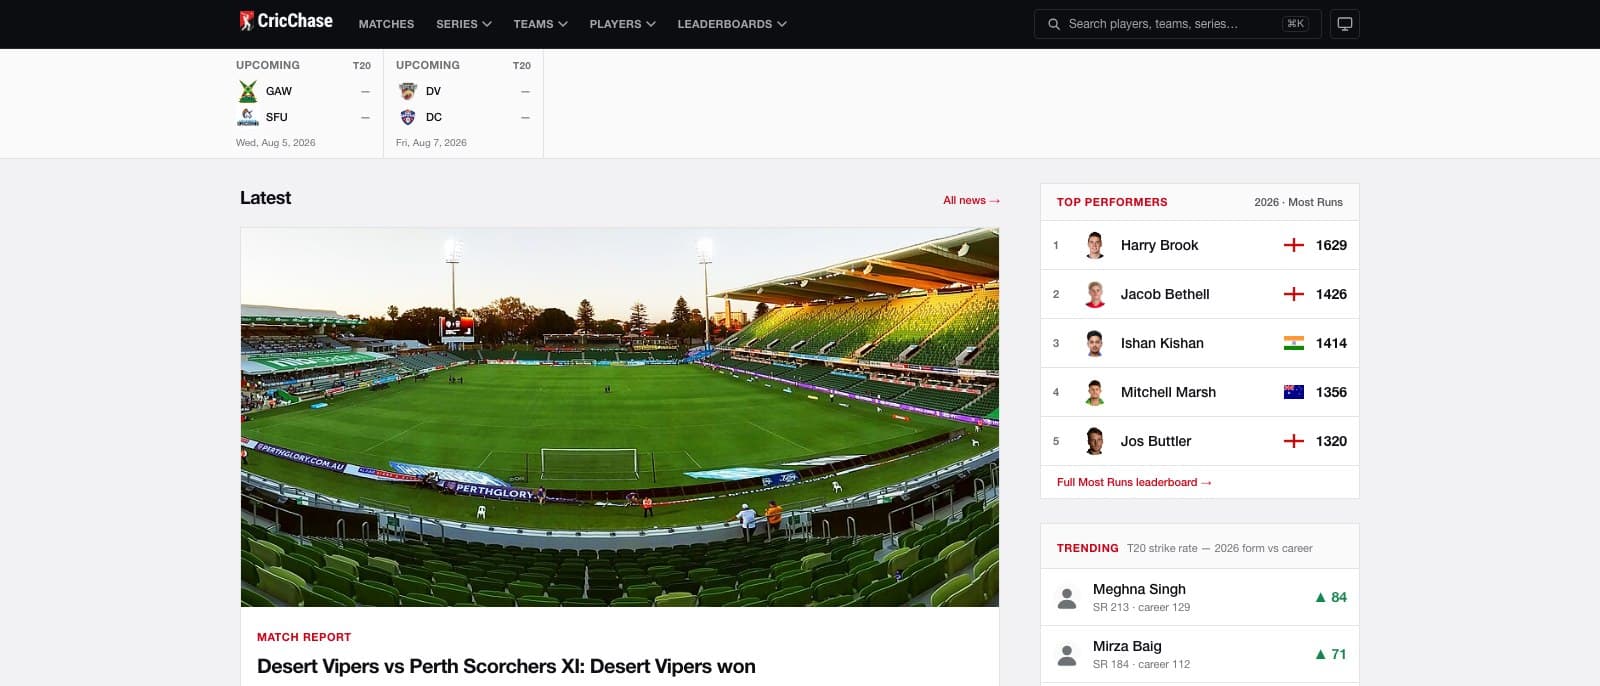
That gap between what happened and what it meant became the starting point for CricChase, a live cricket scores and analytics platform. We built it to connect live scores, full scorecards, player and team records, ball-by-ball analytics, expected-value metrics, matchups, and research tools in one fast, searchable product.
Live matches, ball-by-ball commentary, scorecards, and results that open into deeper analysis.
Every delivery indexed by format, phase, bowling type, and outcome across men's and women's cricket.
Runs and wickets above expected, runs saved, and win probability added—not just totals.
Delivery search, batter-versus-bowler matchups, player search, and head-to-head comparisons.
The problem: cricket has scorecards everywhere and context nowhere
Almost every cricket site can tell you the score. Far fewer can tell you what the score is worth. A strike rate of 140 is excellent in a rebuild and ordinary at the death. Three wickets can be a match-winning spell or the product of batters throwing it away in a lost cause. An economy rate means one thing bowling the powerplay and another bowling overs sixteen to twenty.
The raw numbers are also scattered. Career averages live on one page, a live scorecard on another, a head-to-head record almost nowhere. To answer a question like "how does this batter play left-arm spin in the middle overs," a fan usually has to give up—the data exists in the ball-by-ball record, but nothing exposes it.
Flattening cricket into a single average per player throws away the context that makes the average meaningful. Publishing every delivery as raw rows would be technically complete and practically useless.
We designed CricChase around a layered answer: record every delivery precisely, then build the scores, stats, and context-aware metrics on top of that same foundation.
| Product layer | The immediate question | Context CricChase preserves |
|---|---|---|
| Live scores | What is happening now? | Ball-by-ball state, phase, required rate, and momentum |
| Scorecards and records | What did this player or team do? | Format, opposition, venue, and career versus recent form |
| Ball-by-ball analytics | How did it actually happen? | Phase, bowling type, batter hand, and outcome splits |
| Expected-value models | Was it good, given the situation? | Baseline for runs, wickets, and win probability |
| Comparison and discovery | How do two players or teams differ? | Like-for-like splits by format and season |
Turning ball-by-ball data into a measurement layer
The delivery record is CricChase's shared foundation. At the time of writing the platform indexes more than 2.8 million deliveries, each tagged with its format, innings phase, bowling type, batter handedness, and outcome. Live matches feed the same model, so today's game becomes part of the same searchable history the moment it is played.
That foundation powers the ball-by-ball delivery search, which lets anyone slice the entire dataset by the variables that actually change a game:
- Format—Test, ODI, T20I, franchise T20, and T10
- Phase—powerplay (overs 1–6), middle (overs 7–15), and death (overs 16+)
- Bowling type—pace or spin
- Batter—right- or left-handed
- Outcome—dot balls, fours, sixes, boundaries, or wickets
Rather than dumping raw rows, the tool returns an aggregated summary—balls, runs, run rate, strike rate, boundary percentage, dot percentage, wickets, and average—so a broad question resolves into a clear answer instead of a spreadsheet. The same delivery data drives live scores and the full match scorecards, which means the number on the live page and the number in the historical query come from one source, not two that quietly disagree.
Leaderboards that separate output from impact
One list of "most runs" cannot describe a sport. The leading run-scorer is not automatically the most efficient, the most destructive, or the most valuable in a chase. The CricChase leaderboards split those questions into focused boards, filterable by format and season.
The batting boards cover most runs, batting average, strike rate, most hundreds, most sixes, and highest score—the familiar output measures. Then two boards go further: runs above expected, which measures a batter against a situation baseline rather than a flat average, and win probability added (chasing), a clutch metric for how much a batter shifted the odds while running down a target.
The bowling boards do the same. Alongside most wickets, bowling average, economy rate, strike rate, and best figures sit runs saved, which credits a bowler for going for fewer runs than an average bowler would in the same overs, and wickets above expected, which grades a return against the difficulty of the situation.
Keeping the ranking rule next to the result matters. A user can see whether a board reflects raw output, efficiency, or context-adjusted impact instead of assuming every list is another aggregate of totals.
Expected stats: performance against the situation, not just the total
The metrics above share one idea, and CricChase gives that idea its own home in expected stats. The principle is simple to state and hard to build: model what an average performance would look like in a given situation, then measure the actual performance against it.
Runs above expected asks whether a batter scored more than the match state and conditions would predict. Wickets above expected and runs saved do the same for bowlers, separating a genuinely good spell from one flattered by easy wickets or punished by a flat pitch. Win probability added translates individual moments into their effect on the result, so a calm, unbeaten chase is valued for what it actually achieved.
None of these are presented as official governing-body statistics, and none claim access to private data. Each is a transparent, versioned model built on the public delivery record. The point is not to replace traditional numbers but to give them context: a strike rate tells you how fast, and expected stats tell you how good, given the game around it.
Every matchup, down to the delivery
Cricket is a sequence of individual duels, and the delivery record makes those duels measurable. The batter-versus-bowler matchup tool reconstructs the head-to-head history between any two players from every delivery one has bowled to the other.
Because a handful of balls proves nothing, a matchup only appears once the two players have faced each other for at least thirty deliveries—enough to be worth reading. The most-contested pairings accumulate real samples: Joe Root has faced Ravindra Jadeja for 1,170 balls, scoring 639 runs. That is not trivia; it is the kind of evidence a captain, a fantasy player, or a curious fan actually wants before a contest.
The matchup view is built on the same indexed deliveries as everything else, so it stays consistent with the leaderboards, the scorecards, and the delivery search rather than living as an isolated statistic.
Comparisons and player research
Two more surfaces turn the database into research rather than reference. The player comparison tool puts two to four players side by side on like-for-like splits, and the team comparison tool does the same at the squad level, framed by format and season so the comparison stays fair.
For open-ended questions, player search lets someone move through the player base by the criteria that matter to them instead of scrolling a single alphabetical list. Together these tools answer the question a scorecard never can: not only what a player did, but how they compare to the specific player, era, or format a fan has in mind.
Formats, teams, and coverage in one model
Cricket is not one competition, and CricChase treats every level as part of the same structure. The delivery model spans Test, ODI, and T20 internationals alongside franchise T20 and T10, and it covers men's and women's cricket rather than treating the women's game as an afterthought.
That coverage is navigable, not just present. Team pages organize national sides and franchises with their squads and records; series and tournament pages hold standings, fixtures, and group stages; venue pages capture where matches are played and how those grounds behave. The schedule and results surfaces tie the calendar together, so a user can move from an upcoming fixture to the two squads to their head-to-head history without leaving the product.
Live scores that lead somewhere
Live scoring is the front door, but on CricChase it is a door into the rest of the platform rather than a dead end. The live scores page carries ball-by-ball state during a match, and every player and team on it links back to the same profiles, matchups, and expected-value metrics that power the analytics.
That connection is the difference. A fan watching a chase can jump from the live required rate to the batter's record against the bowler on strike, to how batters generally fare in that phase, to whether this innings is beating expectation—all from the same delivery model. Match reports and editorial coverage in the news section sit beside the data rather than replacing it, so a story can point at the numbers behind it.
Search architecture for a delivery-level dataset
CricChase's information architecture creates stable, descriptive routes for matches, series, teams, players, venues, leaderboards, matchups, comparisons, and analytics. Important information is not hidden behind a single client-side dashboard or one search box.
A match can lead to its scorecard, its venue, and the two squads. A player can lead to their record, their matchups, and a comparison. A leaderboard can lead to the player behind the ranking. Those relationships make the product easier to explore, and they also give search engines crawlable paths through the same data graph. Focused page titles, stable URLs, server-rendered content, and contextual internal links let one system serve both fans and search discovery—the difference between a database that is technically online and one that can actually be found.
What we learned building CricChase
The central lesson was that context is not a feature bolted onto statistics—it is the statistic. A number without its situation is not neutral; it is misleading in a quiet way. CricChase works because the strike rate, the economy, the matchup, and the expected-value model all descend from the same delivery record, so they agree with each other and carry their situation with them.
Building it reinforced the value of separating three kinds of information:
- Measured data: the recorded, timestamped delivery-level record of what physically happened
- Reference knowledge: player identities, squads, series, venues, and the fixtures that organize them
- Derived analysis: expected values, win probability, matchups, and comparisons built on top of the measured layer
When those layers are labeled clearly, the product can be both fast for a casual score check and deep for genuine research without the two getting in each other's way.
That is the same approach we use when building custom software platforms: the data model, ingestion pipeline, interface, metrics, and search architecture should be designed as one system. CricChase is fast because live scores and deep analytics are two views of a single delivery model, not two products stitched together.
Explore CricChase
CricChase is live and expanding across formats, competitions, and the women's game. A fan can follow a live match, open a full scorecard, search two and a half million deliveries, grade an innings against expectation, reconstruct a batter-versus-bowler duel, compare two players, or check how a side has fared at a venue.
CricChase is an independent cricket statistics and analytics website and is not affiliated with, endorsed by, or sponsored by the ICC, any national cricket board, or any league or franchise whose data it references. Team names, player names, and competition names belong to their respective owners.